Description
How to Use:
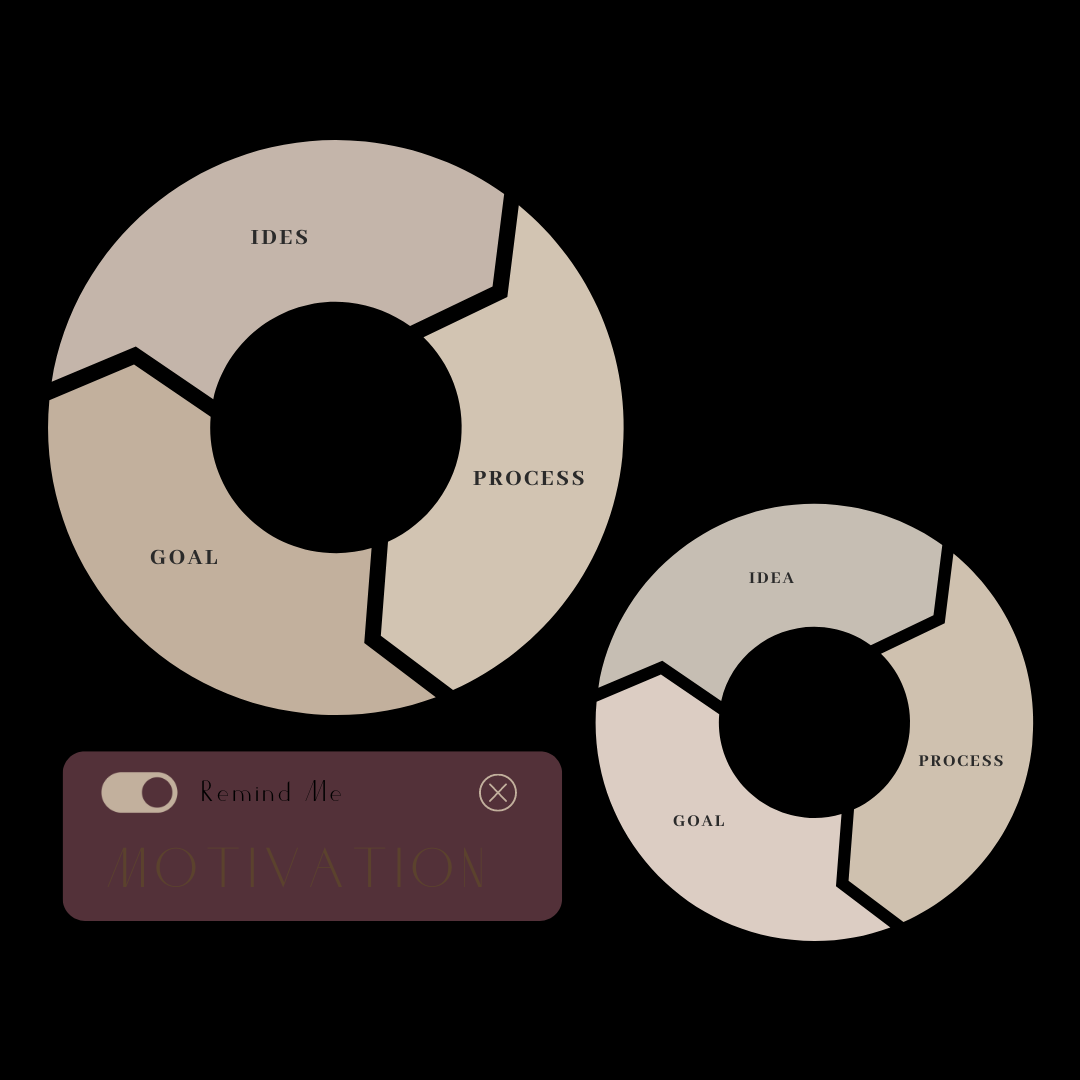
Add your progress data to the template’s chart sections. Customize the colors and labels to fit your needs. Export and use for reports, presentations, or social media updates.
Features:
– Customizable progress charts
– Editable data fields
– High-resolution graphics
– Easy-to-use design
Why It’s Best:
Our Graphical Chart for Progress template makes it easy to visualize and track progress. Its professional design and customizable features help you present data clearly and effectively, making it ideal for reports and presentations.


Reviews
There are no reviews yet.